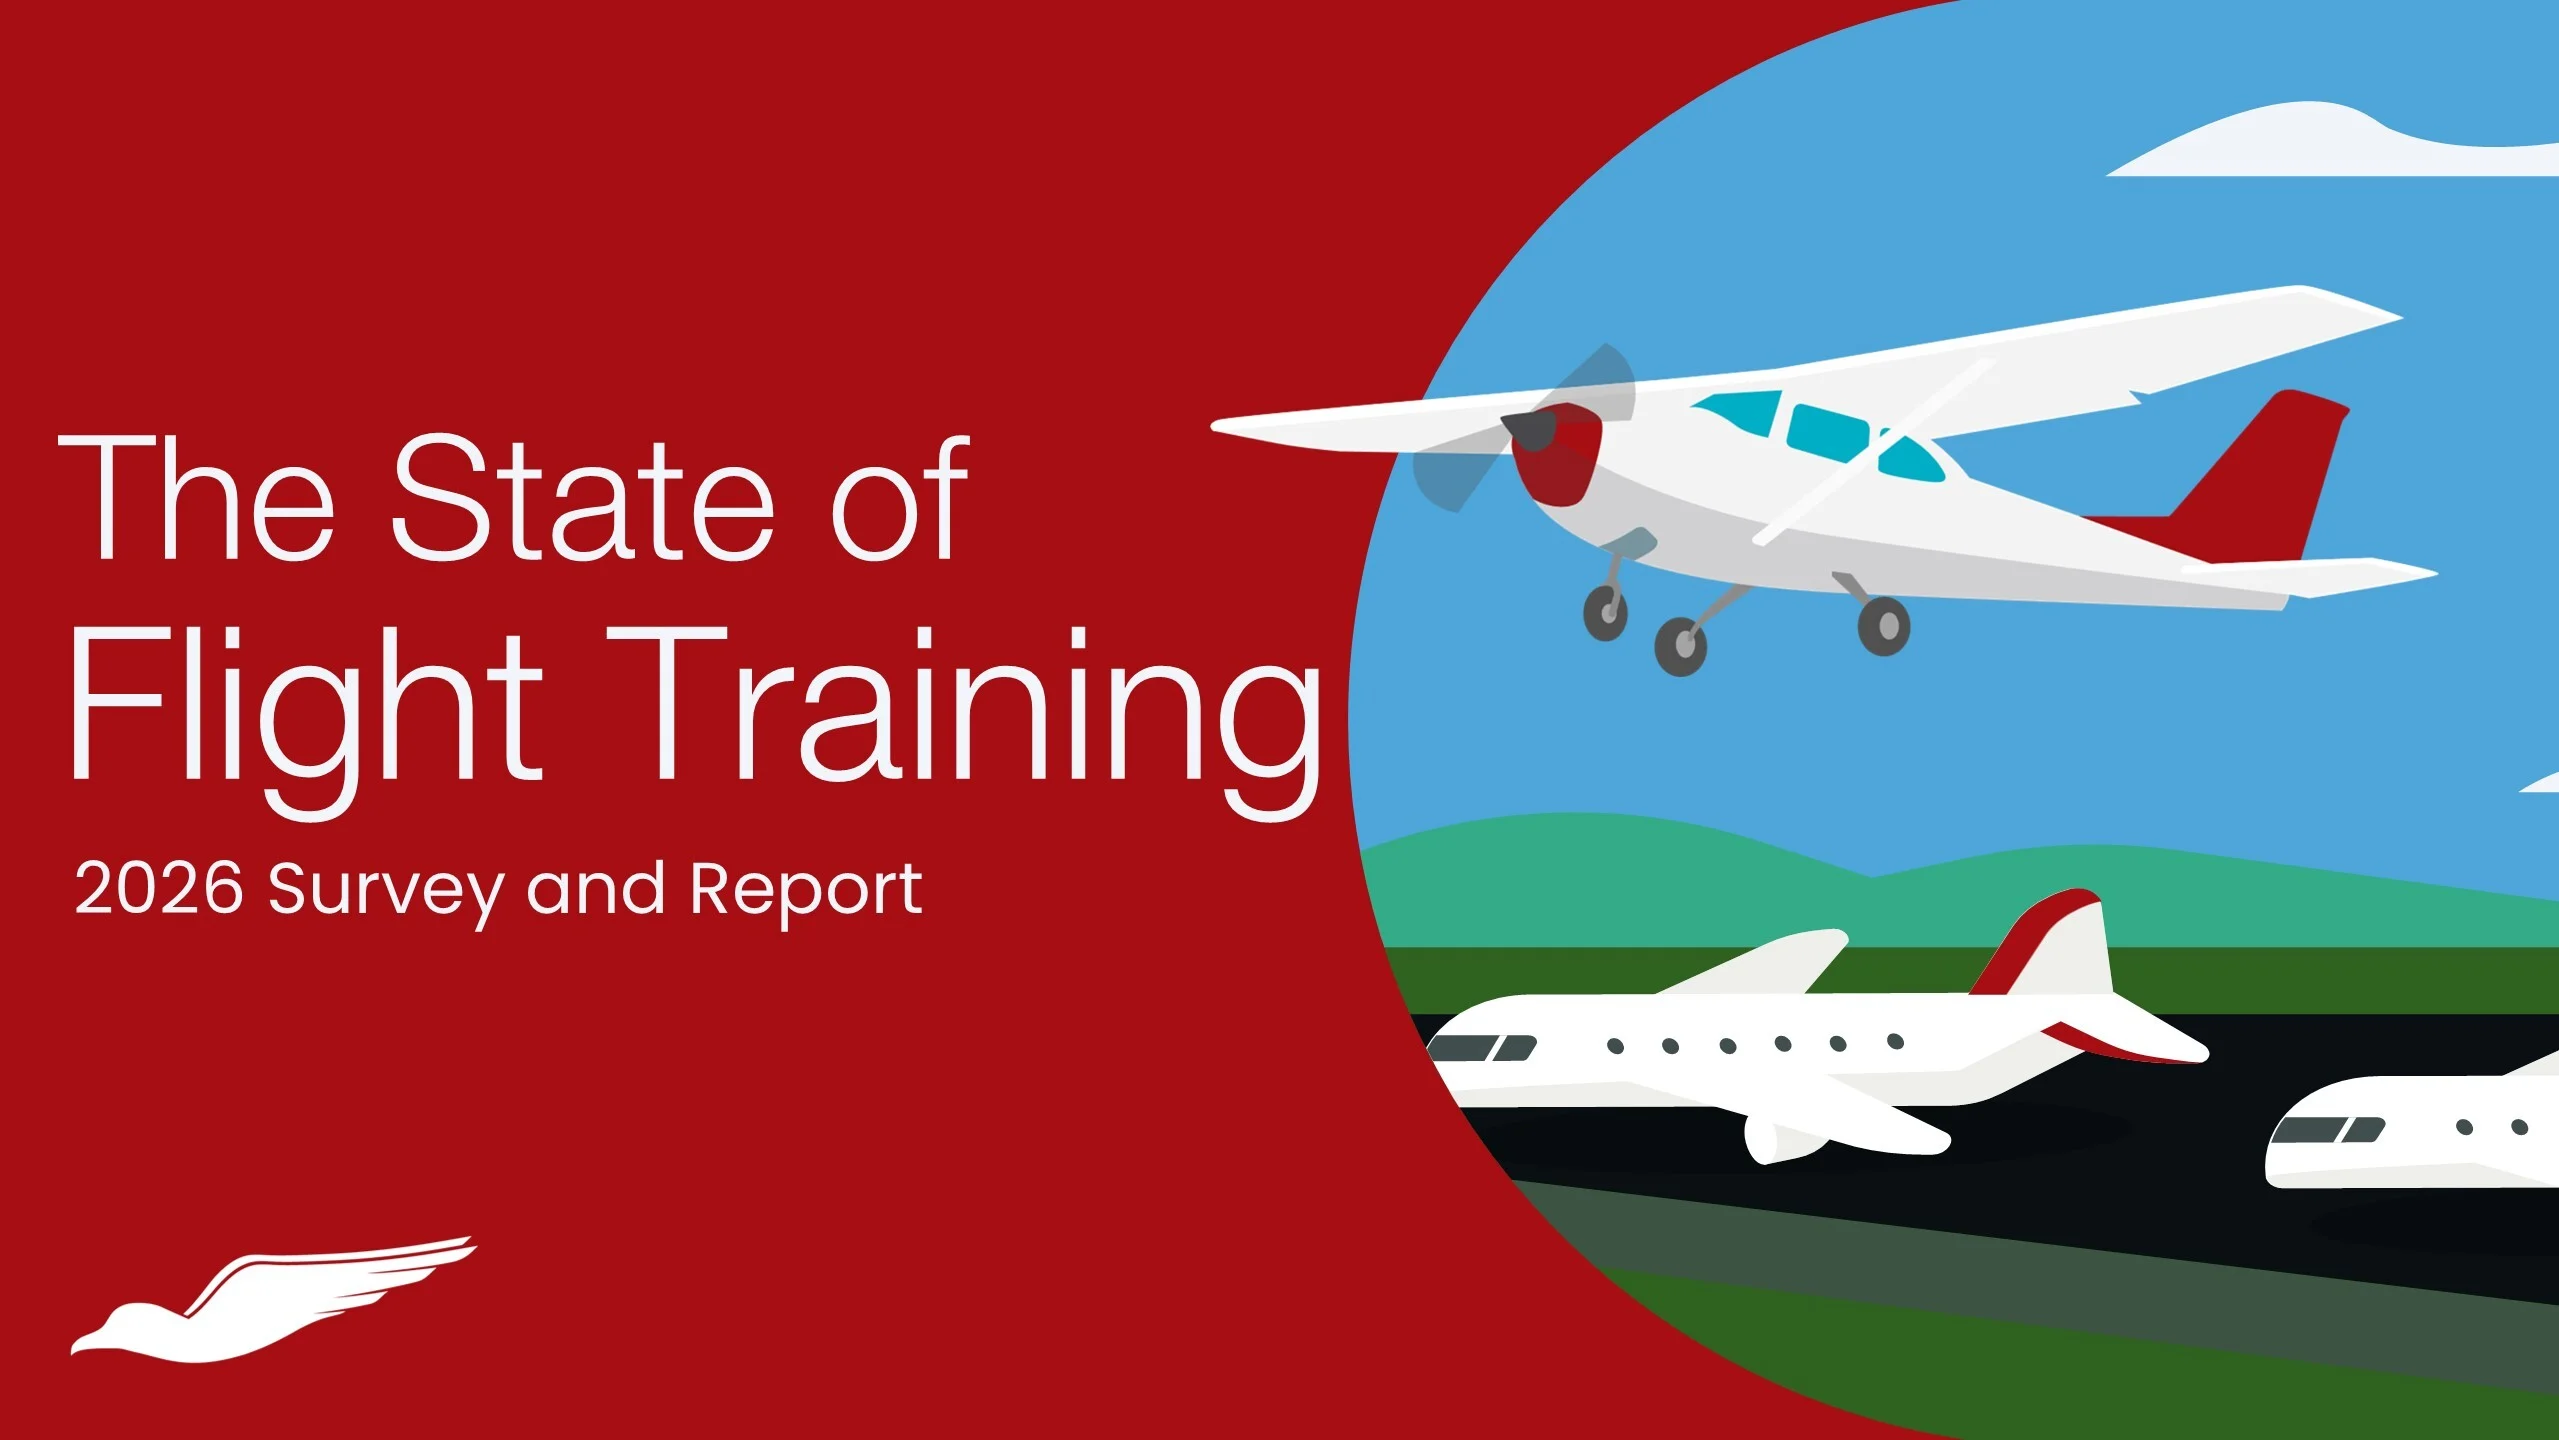
Redbird Flight released its annual State of Flight Training 2026 Survey and Report based on responses from 1,180 industry participants — flight training organizations, independent CFIs, active and lapsed pilots, active and prospective students, and Designated Pilot Examiners. The report paints a picture of an industry navigating four converging pressures: rising costs (the median Private Pilot License now runs $16,500, up from $9,000 in 2020 — an 83% increase in five years), a DPE bottleneck that has become the industry’s #1 challenge, declining syllabus usage by CFIs (only 53% used a syllabus in 2025 vs. 68% in 2024), and accelerating consolidation among large flight training organizations. Yet the report also captures reasons for optimism: business outlook among training providers is improving, first-time checkride pass rates remain strong, and simulator use is projected to reach 80% of active students in 2026.
For anyone considering flight training, running a flight school, working as a CFI, or evaluating the pilot pipeline that feeds airline hiring, the report’s findings deserve close attention. Here’s what the data actually shows and what it means for aviation’s near future.
The Headline: Flight Training Costs Are Up 83% Since 2020
The single most consequential finding in the 2026 report is the sustained cost inflation across flight training. The median cost to complete a Private Pilot License (PPL) has moved from $9,000 in 2020 to $16,500 in 2025 — an increase of $7,500, or approximately 83%, over five years. That’s a compound annual growth rate of roughly 13% — well above general inflation.
Instrument Rating (IR) costs have followed a similar arc, moving from $7,500 in 2020 to $11,500 in 2025 (a 53% increase, though modestly declining from the $12,750 peak in 2024).
The 2025 median cost snapshot across all major certificates:
| Certificate/Rating | Median Cost (2025) | Median Weeks |
|---|---|---|
| Sport Pilot | $12,000 | 16 |
| Private Pilot License (PPL) | $16,500 | 24 |
| Instrument Rating (IR) | $11,500 | 15 |
| Commercial Pilot License (CPL) | $10,000 | 12 |
| Multi-Engine Add-On | $6,000 | 2 |
| CFI Initial | $5,500 | 8 |
| CFI Add-On | $4,000 | 4 |
| Airline Transport Pilot (ATPL) | $5,000 | 2 |
Adding these together, the cumulative cost of moving from zero flight experience to ATPL now approaches $55,000-$65,000 depending on multi-engine, CFI, and other pathway choices — not including hour-building beyond the certificates themselves, medical certification, written exam prep, and DPE fees.
For prospective students weighing aviation careers, that number matters. It’s the cost that determines whether flight training remains accessible to the broad middle-class recruit pipeline the industry has historically depended on.
The DPE Bottleneck Has Become the #1 Industry Challenge
Both flight training organizations and independent CFIs ranked Pilot Examiner Issues as their #1 challenge in 2025 — up from #2 for FTOs in 2024. This shift matters because it reflects an operational reality: aviation schools can be running perfectly and still lose weeks or months waiting for a Designated Pilot Examiner (DPE) to conduct a checkride.
The 2025 DPE workload data explains why:
- 100 median applicants per DPE (essentially, each DPE conducts about 2 applicant sessions per week when working full-time)
- 120 average applicants per DPE (the average is inflated by the busiest examiners)
- 52% of DPEs charge $800 to $1,000 per checkride
- Only 26% of DPEs reported having a waitlist in 2025, down significantly from 52% in 2024
The 2024-to-2025 shift in DPE waitlists (52% → 26%) is a positive signal — DPE availability improved meaningfully year over year. But 42% of DPEs still reported being “very busy” in 2025, and the top-ranked challenge from training providers has moved up rather than down. That paradox likely reflects geographic and rating-specific mismatches: DPEs may be available somewhere in the country, but not necessarily in the right region for the right rating at the right time.
Notably, the top FTO challenges shifted between 2024 and 2025:
- Pilot Examiner Issues (moved from #2 to #1, +1)
- Cost of Aircraft Insurance (moved from #1 to #2, -1)
- Aircraft Maintenance (unchanged at #3)
- Economic Uncertainty (unchanged at #4)
- Finding New Students (moved from off-list to #5, +3)
For independent CFIs, the top three challenges remain Pilot Examiner Issues, Cost of Aircraft Insurance, and Access to Training Aircraft — with Finding New Students appearing on the CFI list for the first time in years, jumping to #5.
Syllabus Use Is Declining — and That Should Worry Everyone
One of the most concerning findings is the decline in CFI syllabus use. Only 53% of students in 2025 reported that their CFI used a syllabus (35% “given a copy” + 18% “not given a copy”) — down from 68% in 2024 (49% + 19%). Meanwhile, the percentage of students reporting their CFI did not use a syllabus jumped from 21% in 2024 to 37% in 2025.
A syllabus in flight training isn’t a formality. It’s the tool that structures lessons, ensures FAR/AIM regulatory topics are covered, sequences maneuvers appropriately, and gives students visibility into their progress. When 37% of students report no syllabus at all being used, that’s an industry-wide quality signal that deserves scrutiny.
Combined with another 2025 data point — 74% of active students had more than one primary CFI in 2025, up from 66% in 2023 — the picture that emerges is one where students are increasingly cycling through instructors without a consistent training plan connecting the sessions. That combination of instructor turnover and syllabus abandonment is exactly the pattern that historically drives up training time, cost, and checkride failure rates.
For flight schools and CFIs, the takeaway is direct: syllabus use is not optional. It’s foundational to training quality, and the industry’s slide away from consistent syllabus use is a leading indicator worth reversing.
Checkride Pass Rates Look Healthy — But DPEs See Applicants Getting Worse
First-time checkride pass rates remain strong across the reporting groups:
- FTOs reported first-time pass rate: 86% average, 90% median
- Independent CFIs reported first-time pass rate: 70% average, 97% median
- DPEs reported first-time pass rate: 76% average, 80% median
The gap between DPE-reported pass rates (76% average) and CFI-reported pass rates (70% average, 97% median) is worth noting. DPEs — who see all applicants across multiple schools — likely have more accurate aggregate visibility. Individual CFIs may over-report success because they self-select the students they endorse for checkrides.
More concerning: DPEs increasingly rate applicants as worse-prepared than five years ago.
- 7% say applicants are “Better” than five years ago (down from 8% in 2024)
- 26% say “Same” (down from 35%)
- 45% say “Worse” (up from 30%)
- 21% say “Much Worse” (down slightly from 23%)
Combined, 66% of DPEs report applicants are worse or much worse than five years ago — up from 53% in 2024. That’s a 13-point deterioration in DPE-perceived applicant quality in a single year.
The 2025 primary reasons for checkride failure, ranked by DPEs:
- Piloting Skill — 3.6 (up from 3.3 in 2024)
- Training Oversight — 3.0 (down from 3.7 in 2024)
- Knowledge – Ground — 2.9 (down from 3.2 in 2024)
- ADM (Aeronautical Decision-Making) — 2.3 (down from 2.5 in 2024)
- Knowledge – Inflight — 2.3 (down from 2.4 in 2024)
The upward move in Piloting Skill and the decline in Training Oversight suggest that the syllabus and instructor turnover problems described earlier are already showing up in checkride outcomes. Students are being sent to checkrides with weaker stick-and-rudder skills, likely because the multiple-CFI-with-no-syllabus dynamic is producing gaps that individual instructors miss.
Bigger FTOs Are Winning — and Getting Bigger
The 2026 report captures a clear consolidation trend: large flight training organizations are outperforming smaller ones on business outcomes, and they’re expanding faster.
Self-rated business outcomes (2020-2025, scale of 1-5):
- Independent CFIs: 2.9 (2020) → 3.5 (2025)
- Small FTOs: 3.5 (2020) → 3.7 (2025)
- Medium FTOs: 3.5 (2020) → 3.8 (2025)
- Large FTOs: 4.2 (2020) → 4.1 (2025)
Large FTOs consistently outperform all other groups by 0.3-1.2 rating points across every year measured. The gap has narrowed slightly since 2023’s 4.6 peak but remains substantial.
Equally significant, large FTOs are becoming multi-location operations at an accelerating rate:
Large FTO location distribution:
- 2020: 84% one location, 10% 2-3 locations, 6% 4-5 locations
- 2025: 33% one location, 17% 2-3 locations, 23% 4-5 locations, 11% 6-10 locations, 11% 10+ locations
The share of large FTOs operating a single location has collapsed from 84% to 33% in five years. Twenty-two percent of large FTOs now operate at six or more locations. This is the direct evidence of the industry consolidation trend that AVweb, FlyingMag, and other outlets have covered anecdotally throughout 2024 and 2025.
The 2026 median FTO snapshot by size:
| Metric | Small FTO | Medium FTO | Large FTO |
|---|---|---|---|
| Training Aircraft | 4 | 16 | 51 |
| Simulators | 1 | 2 | 8 |
| Flight Instructors | 5 | 18 | 81 |
| Profit Margin | 12% | 15% | 18% |
Profit margin scaling with size (12% → 15% → 18%) is a direct financial illustration of why larger operations are winning — and why consolidation is accelerating. 18% of small FTOs are not profitable at all, which by itself explains a substantial share of the closure and acquisition activity across the industry.
The Positives: Simulator Use, Optimism, and Business Ratings
The 2026 report isn’t all warnings. Several data points suggest genuine improvement:
Simulator use is going mainstream. 80% of active students plan to use a simulator in 2026 — a substantial number that reflects the industry’s growing recognition that BATD/AATD/FTD time is both effective and cost-efficient training. The typical hourly rates in the report — $20 for BATD, $75 for AATD, $35 for FTD — are dramatically lower than the $180 median hourly rate for a training aircraft or $225 for an advanced aircraft.
Business outlook is improving.
- Independent CFIs: 3.6 outlook for 2026 (up from 3.4)
- FTOs: 4.1 outlook for 2026 (same as 2024)
Both segments are looking forward more positively than they did entering 2024, suggesting the post-pandemic normalization has produced a more sustainable business environment.
Training ratings remain strong. Students rated their overall training experience 4.1 out of 5, their flight instructors 4.3 out of 5, and their flight schools 3.4 out of 5. The gap between flight instructor ratings and flight school ratings suggests that individual CFIs are frequently the strongest part of the training experience — a signal to school operators about where operational investment could pay off.
What This Means for Prospective Pilots
For anyone considering flight training in 2026 or 2027, several practical implications emerge from the Redbird data:
Budget honestly for the full pathway. A PPL at $16,500 is only the beginning. Add IR ($11,500), CPL ($10,000), Multi ($6,000), CFI Initial ($5,500), and ATPL ($5,000) — plus DPE fees ($800-$1,000 each), medical exams, written exam prep, and hour-building — and the full commercial pathway now approaches $55,000-$70,000 before you account for lost income during training.
Ask your prospective flight school about their syllabus. If they don’t use one — or can’t hand you a printed copy of the structure they’ll follow — walk away. The 37% of students in 2025 who reported no syllabus use are the ones most at risk of the extended training times, higher costs, and lower checkride pass rates the data suggests.
Look for CFI continuity. With 74% of students now cycling through multiple primary CFIs, deliberately choosing a school that assigns and maintains a primary instructor becomes a differentiator.
Ask about DPE access. Before enrolling, ask your prospective school where their applicants take checkrides and how long the typical wait is. If the answer is “we don’t know” or “it varies,” that’s a warning. Well-organized schools have relationships with specific DPEs and can quote you typical wait times.
Prioritize simulator time. With BATD hourly rates around $20 vs. $180 for training aircraft, structured simulator use is one of the most straightforward ways to reduce cost per hour without sacrificing training quality. Ask your prospective school specifically about their sim integration.
What This Means for Flight Schools and CFIs
For training providers, the Redbird data points to several strategic priorities:
Fix the syllabus problem. The 15-percentage-point decline in syllabus use between 2024 and 2025 is fixable. School managers should audit their instructor workforce and require that every student has a signed-off syllabus at the start of training.
Invest in CFI retention. With 74% of students cycling through multiple primary CFIs, retention becomes an operational priority — not just an HR one. Schools losing instructors mid-training are the same schools reporting extended completion times and checkride failures.
Scale simulator infrastructure. The 80%-of-students planning to use simulators number is a mandate. If your school still runs training exclusively in aircraft, you’re both more expensive than competitors and missing a training-quality opportunity.
Consider consolidation carefully. The 18% not-profitable rate among small FTOs and the accelerating multi-location expansion among large FTOs both suggest that mid-tier schools face a strategic choice: grow, join a larger network, or specialize deeply. The “one-location Cessna 172 rental” model that dominated GA for decades is under structural pressure.
Track your own DPE relationships. The DPE bottleneck may be #1 industry-wide, but schools with strong DPE relationships and geographic diversity can turn it into a competitive advantage. Publish typical checkride wait times to prospective students.
How This Connects to the Broader Industry Picture
The Redbird findings intersect with several major industry stories from 2026:
- Cirrus Aircraft’s TRAC10 launch (July 6, 2026) — a purpose-built trainer targeting professional flight schools, with 100+ orders already secured from 13 flight schools
- The Cirrus Talent Center (June 26, 2026) — a $50M+ workforce development investment
- MOSAIC Phase 2 (July 24, 2026) — expanded LSA framework that could bring new categories of aircraft into training fleets
- FAA’s $26M Aviation Workforce Development Grants (May 2026)
- Boeing’s forecast of 130,000+ new North American pilots needed over the next decade
- The FAA’s 2026 Air Traffic Controller Workforce Plan (2,200 hires targeted for 2026)
Taken together, the picture is of an industry navigating growth pressure alongside operational challenges. Demand exists. Financial capital is being deployed. Regulatory modernization is expanding possibilities. But the pipeline that turns aspirants into pilots — flight training itself — is showing operational strain, cost inflation, and consolidation pressure that could constrain how quickly the industry actually delivers on its growth potential.
The Bottom Line
Redbird’s State of Flight Training 2026 report is one of the most substantive data resources for anyone trying to understand America’s pilot pipeline right now. The cost inflation, the DPE bottleneck, the syllabus decline, the CFI turnover, and the consolidation trends are all significant challenges. The improving business outlook, simulator adoption, and steady checkride pass rates are meaningful positives.
For prospective pilots, the report suggests that flight training remains achievable but demands more careful school selection, longer time budgeting, and honest financial planning than it did five years ago. For flight schools and CFIs, the data provides a diagnostic on where operational investment can move the needle. For the broader aviation industry, it’s a reminder that solving pilot demand isn’t just about aircraft, capital, and regulation — it’s about the small businesses, individual instructors, and daily lesson choices that turn a $16,500 investment into a pilot certificate.
The full Redbird report is available at redbirdflight.com, and the underlying dataset of 1,180 industry respondents makes this one of the most citable resources in the flight training conversation for the year ahead.
Frequently Asked Questions
What is the median cost of getting a Private Pilot License (PPL) in 2025? According to Redbird Flight’s State of Flight Training 2026 Report, the median cost of completing a Private Pilot License in 2025 was $16,500 — up from $14,000 in 2024 and $9,000 in 2020. This represents an 83% increase over five years, or approximately 13% compound annual growth. The median PPL completion time in 2025 was 24 weeks.
How long does it take to complete flight training in 2025? Based on Redbird’s 2026 report, the median completion times in 2025 were: Sport Pilot (16 weeks), Private Pilot License (24 weeks), Instrument Rating (15 weeks), Commercial Pilot License (12 weeks), Multi-Engine Add-On (2 weeks), CFI Initial (8 weeks), CFI Add-On (4 weeks), and ATPL (2 weeks). Full progression from zero flight time to Airline Transport Pilot certification typically spans 12-18 months of dedicated training plus additional hour-building time.
What is the biggest challenge facing flight training organizations in 2025? According to Redbird’s State of Flight Training 2026 Report, Pilot Examiner Issues (DPE availability) is the #1 challenge facing both flight training organizations and independent CFIs in 2025, moving up from #2 for FTOs in 2024. Cost of Aircraft Insurance is #2, followed by Aircraft Maintenance, Economic Uncertainty, and Finding New Students (a new #5 that jumped 3 positions from 2024).
Are flight training checkride pass rates going up or down? First-time checkride pass rates remain relatively strong in 2025: FTOs reported 86% average / 90% median, DPEs reported 76% average / 80% median, and Independent CFIs reported 70% average / 97% median. However, 66% of DPEs report that applicants are worse-prepared than they were five years ago — up 13 points from 53% in 2024. Piloting Skill has become the #1 reason for checkride failure, replacing Training Oversight.
Where can I access Redbird’s State of Flight Training 2026 Report? The full State of Flight Training 2026 Survey and Report is available at redbirdflight.com. The report is based on 1,180 responses from industry participants across the United States (89%), Canada (3%), and other international markets (8%), including Flight Training Organizations (22%), Independent CFIs (19%), Active Pilots (20%), Lapsed Pilots (11%), FTO Flight Instructors (10%), Active Students (8%), Designated Pilot Examiners (4%), and Prospective Students (3%).
Sources: